Plus One Degree
Tasks
|
||||||
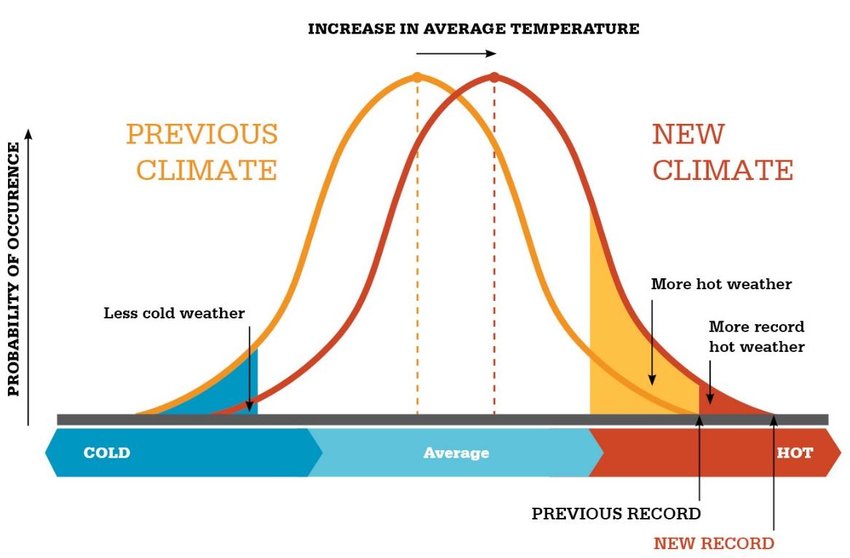
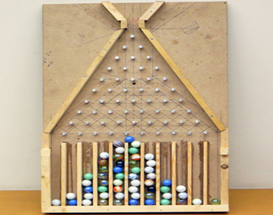
MathsThe Earth is getting warmer and is now 1°C warmer than it was a century ago. But why does this matter? Daily temperatures create a bell curve, where most days are moderate and only a few days are very hot. When global temperature rises, that bell curve is shifted to the right. This means that hot days will happen more frequently, and the hottest days will become even hotter.
In the UK, the number of days over 28°C has more than doubled since last century, and days over 30°C has more than tripled. This has led to more extreme weather which hurts crops and wildlife. The peg board creates a bell curve because there are many paths that end around the middle, and only a few paths that end near the extreme ends. |
||||||
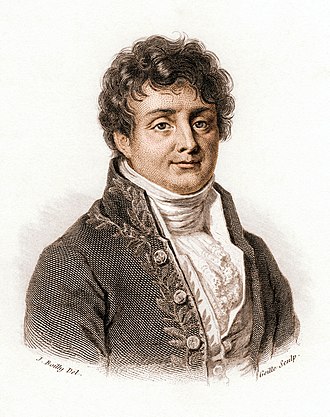
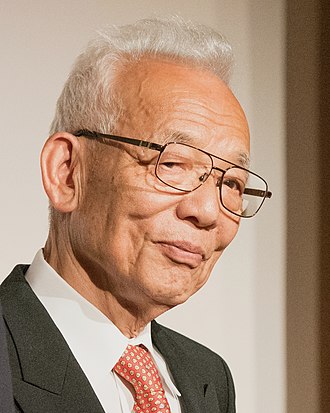
HistoryIn the 1820s, French mathematician and physicist, Joseph Fourier first explained the greenhouse effect – where sunlight that reaches the Earth’s surface is converted to heat which is then trapped by the Earth’s atmosphere. In 1896, Swedish scientist, Svante Arrhenius, created the first climate model that showed that increasing the levels of CO2 in the atmosphere would lead to an increase in temperature. In the 1960s and 1970s, Japanese-American physicist, Suki Manabe, created mathematical models based on the circulation of the planet’s atmosphere and oceans. These models predicted that doubling CO2 in the atmosphere would increase the global temperature by over 2°C. |
||||||
People
|
||||||
ApplicationsClimate models use the mathematics of physics, fluid motion and chemistry to forecast climate change. Climate models are tested on past data to see how accurately they predict current observations, before being used to forecast the future of climate change. Climate models continure to improve, and forecasts have become increasingly more accurate. |
||||||
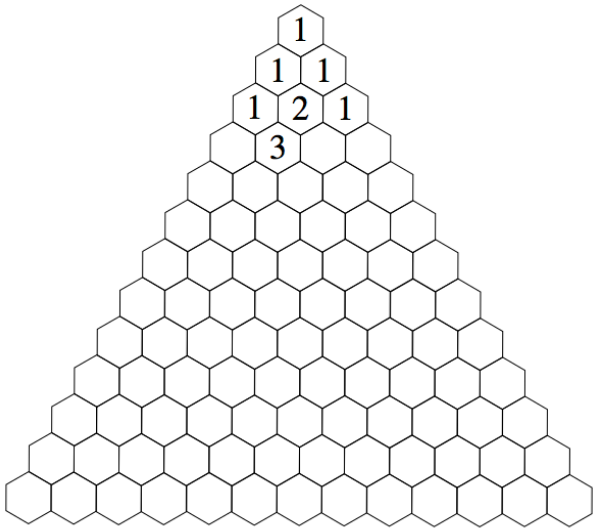
Maths at HomeThe exhibit pegboard creates a bell curve because there are more paths that end in the middle than paths that end at the extreme ends. We can work out how many paths there are at each step using the following picture.
On the third row, there are two paths that end in the middle (a ball could travel left-right or right-left). But at the extreme left only has one path (a ball must travel left-left). The same is true for the extreme right. On the fourth row, we have filled in one of the hexagons to show that there are 3 paths that end at this position (left-left-right, left-right-left and right-left-left). The clever trick here is that we can find this number by adding up the two numbers above it. Use this trick to fill in the rest of the triangle. How many paths are there to middle of the 10th row? This picture is known as Pascal’s triangle and it has many surprising mathematical properties. |